はじめに
Nmapで実際にポートスキャンをしてみた。
検証環境は TryHackMe の Nmap ルーム。
TCPスキャン
使用頻度上位 100 ポートのみ(–top-ports 100)、スキャン中の詳細を表示(-vv)、pingをスキップ(-Pn)して
TCPスキャン(-sT)。
$ sudo nmap -sT --top-ports 100 -vv -Pn target ipopenポートを発見。
Host discovery disabled (-Pn). All addresses will be marked 'up' and scan times may be slower.
Starting Nmap 7.95 ( https://nmap.org ) at 2025-10-23 23:57 JST
Initiating Parallel DNS resolution of 1 host. at 23:57
Completed Parallel DNS resolution of 1 host. at 23:57, 0.00s elapsed
Initiating Connect Scan at 23:57
Scanning target ip [100 ports]
Discovered open port 3389/tcp on target ip
Discovered open port 135/tcp on target ip
Discovered open port 80/tcp on target ip
Discovered open port 21/tcp on target ip
Discovered open port 53/tcp on target ip
Completed Connect Scan at 23:57, 7.02s elapsed (100 total ports)
Nmap scan report for target ip
Host is up, received user-set (0.37s latency).
Scanned at 2025-10-23 23:57:10 JST for 7s
Not shown: 95 filtered tcp ports (no-response)
PORT     STATE SERVICE       REASON
21/tcp   open  ftp           syn-ack
53/tcp   open  domain        syn-ack
80/tcp   open  http          syn-ack
135/tcp  open  msrpc         syn-ack
3389/tcp open  ms-wbt-server syn-ack

Read data files from: /usr/share/nmap
Nmap done: 1 IP address (1 host up) scanned in 7.03 seconds
tshark でログを取っていたので確認してみる。
# tshark の結果を sT_result.txt へ出力
$ sudo tshark -i tun0 > sT_result.txt
Running as user "root" and group "root". This could be dangerous.
Capturing on 'tun0'
237 ^C
# cat で全体のログを確認
$ cat sT_result.txt
1 0.000000000 host ip → target ip TCP 60 34450 → 111 [SYN] Seq=0 Win=64240 Len=0 MSS=1460 SACK_PERM TSval=245774735 TSecr=0 WS=128
2 0.000013296 host ip → target ip TCP 60 47774 → 113 [SYN] Seq=0 Win=64240 Len=0 MSS=1460 SACK_PERM TSval=245774735 TSecr=0 WS=128
3 0.000018708 host ip → target ip TCP 60 38474 → 135 [SYN] Seq=0 Win=64240 Len=0 MSS=1460 SACK_PERM TSval=245774735 TSecr=0 WS=128
4 0.000025294 host ip → target ip TCP 60 55670 → 5900 [SYN] Seq=0 Win=64240 Len=0 MSS=1460 SACK_PERM TSval=245774735 TSecr=0 WS=128
5 0.000030624 host ip → target ip TCP 60 46124 → 25 [SYN] Seq=0 Win=64240 Len=0 MSS=1460 SACK_PERM TSval=245774735 TSecr=0 WS=128
6 0.000035786 host ip → target ip TCP 60 59490 → 554 [SYN] Seq=0 Win=64240 Len=0 MSS=1460 SACK_PERM TSval=245774735 TSecr=0 WS=128
7 0.000041544 host ip → target ip TCP 60 38960 → 3306 [SYN] Seq=0 Win=64240 Len=0 MSS=1460 SACK_PERM TSval=245774735 TSecr=0 WS=128
8 0.000048233 host ip → target ip TCP 60 57882 → 110 [SYN] Seq=0 Win=64240 Len=0 MSS=1460 SACK_PERM TSval=245774735 TSecr=0 WS=128
9 0.000052118 host ip → target ip TCP 60 42396 → 3389 [SYN] Seq=0 Win=64240 Len=0 MSS=1460 SACK_PERM TSval=245774735 TSecr=0 WS=128
10 0.000059820 host ip → target ip TCP 60 37896 → 8888 [SYN] Seq=0 Win=64240 Len=0 MSS=1460 SACK_PERM TSval=245774735 TSecr=0 WS=128
11 0.377319586 target ip → host ip TCP 52 135 → 38474 [SYN, ACK] Seq=0 Ack=1 Win=65535 Len=0 MSS=1288 WS=256 SACK_PERM
12 0.377390839 host ip → target ip TCP 40 38474 → 135 [ACK] Seq=1 Ack=1 Win=64256 Len=0
13 0.378715797 host ip → target ip TCP 40 38474 → 135 [RST, ACK] Seq=1 Ack=1 Win=64256 Len=0
14 0.378932212 host ip → target ip TCP 60 47616 → 23 [SYN] Seq=0 Win=64240 Len=0 MSS=1460 SACK_PERM TSval=245775114 TSecr=0 WS=128
15 0.378957703 host ip → target ip TCP 60 43838 → 995 [SYN] Seq=0 Win=64240 Len=0 MSS=1460 SACK_PERM TSval=245775114 TSecr=0 WS=128
16 1.027607473 host ip → target ip TCP 60 [TCP Retransmission] 37896 → 8888 [SYN] Seq=0 Win=64240 Len=0 MSS=1460 SACK_PERM TSval=245775763 TSecr=0 WS=128
(省略)ログを絞って確認。
# SYN 以外のログで絞ってみる
$ cat sT_result.txt | grep -v -F "[SYN]"
   11 0.377319586 target ip → host ip   TCP 52 135 → 38474 [SYN, ACK] Seq=0 Ack=1 Win=65535 Len=0 MSS=1288 WS=256 SACK_PERM
   12 0.377390839   host ip → target ip TCP 40 38474 → 135 [ACK] Seq=1 Ack=1 Win=64256 Len=0
   13 0.378715797   host ip → target ip TCP 40 38474 → 135 [RST, ACK] Seq=1 Ack=1 Win=64256 Len=0
   28 2.268681269 target ip → host ip   TCP 52 135 → 38490 [SYN, ACK] Seq=0 Ack=1 Win=65535 Len=0 MSS=1288 WS=256 SACK_PERM
   29 2.268724628   host ip → target ip TCP 40 38490 → 135 [ACK] Seq=1 Ack=1 Win=64256 Len=0
   30 2.268783378   host ip → target ip TCP 40 38490 → 135 [RST, ACK] Seq=1 Ack=1 Win=64256 Len=0
   61 3.272603426 target ip → host ip   TCP 52 21 → 43260 [SYN, ACK] Seq=0 Ack=1 Win=65535 Len=0 MSS=1288 WS=256 SACK_PERM
   62 3.272698420   host ip → target ip TCP 40 43260 → 21 [ACK] Seq=1 Ack=1 Win=64256 Len=0
   63 3.273334678 target ip → host ip   TCP 52 53 → 58022 [SYN, ACK] Seq=0 Ack=1 Win=65535 Len=0 MSS=1288 WS=256 SACK_PERM
   64 3.273357934   host ip → target ip TCP 40 58022 → 53 [ACK] Seq=1 Ack=1 Win=64256 Len=0
   65 3.273693028   host ip → target ip TCP 40 43260 → 21 [RST, ACK] Seq=1 Ack=1 Win=64256 Len=0
   66 3.274013386   host ip → target ip TCP 40 58022 → 53 [RST, ACK] Seq=1 Ack=1 Win=64256 Len=0
   77 3.274796974 target ip → host ip   TCP 52 80 → 49068 [SYN, ACK] Seq=0 Ack=1 Win=65535 Len=0 MSS=1288 WS=256 SACK_PERM
   78 3.274865411   host ip → target ip TCP 40 49068 → 80 [ACK] Seq=1 Ack=1 Win=64256 Len=0
   79 3.274951087   host ip → target ip TCP 40 49068 → 80 [RST, ACK] Seq=1 Ack=1 Win=64256 Len=0
   84 3.387604406 target ip → host ip   TCP 52 3389 → 42396 [SYN, ACK] Seq=0 Ack=1 Win=64000 Len=0 MSS=1288 WS=1 SACK_PERM
   85 3.387628199   host ip → target ip TCP 40 42396 → 3389 [RST] Seq=1 Win=0 Len=0
  150 4.998246831 target ip → host ip   TCP 52 135 → 38502 [SYN, ACK] Seq=0 Ack=1 Win=65535 Len=0 MSS=1288 WS=256 SACK_PERM
  151 4.998329872   host ip → target ip TCP 40 38502 → 135 [ACK] Seq=1 Ack=1 Win=64256 Len=0
  152 4.998587904   host ip → target ip TCP 40 38502 → 135 [RST, ACK] Seq=1 Ack=1 Win=64256 Len=0
  232 6.277318520 target ip → host ip   TCP 52 3389 → 42398 [SYN, ACK] Seq=0 Ack=1 Win=64000 Len=0 MSS=1288 WS=1 SACK_PERM
  233 6.277337412   host ip → target ip TCP 40 42398 → 3389 [RST] Seq=1 Win=0 Len=0
  235 6.857444881 target ip → host ip   TCP 52 135 → 38504 [SYN, ACK] Seq=0 Ack=1 Win=65535 Len=0 MSS=1288 WS=256 SACK_PERM
  236 6.857524021   host ip → target ip TCP 40 38504 → 135 [ACK] Seq=1 Ack=1 Win=64256 Len=0
  237 6.858089282   host ip → target ip TCP 40 38504 → 135 [RST, ACK] Seq=1 Ack=1 Win=64256 Len=0

# SYN/ACK(open)で絞ってみる
$ cat sT_result.txt | grep -F "[SYN, ACK]"
   11 0.377319586 target ip → host ip   TCP 52 135 → 38474 [SYN, ACK] Seq=0 Ack=1 Win=65535 Len=0 MSS=1288 WS=256 SACK_PERM
   28 2.268681269 target ip → host ip   TCP 52 135 → 38490 [SYN, ACK] Seq=0 Ack=1 Win=65535 Len=0 MSS=1288 WS=256 SACK_PERM
   61 3.272603426 target ip → host ip   TCP 52 21 → 43260 [SYN, ACK] Seq=0 Ack=1 Win=65535 Len=0 MSS=1288 WS=256 SACK_PERM
   63 3.273334678 target ip → host ip   TCP 52 53 → 58022 [SYN, ACK] Seq=0 Ack=1 Win=65535 Len=0 MSS=1288 WS=256 SACK_PERM
   77 3.274796974 target ip → host ip   TCP 52 80 → 49068 [SYN, ACK] Seq=0 Ack=1 Win=65535 Len=0 MSS=1288 WS=256 SACK_PERM
   84 3.387604406 target ip → host ip   TCP 52 3389 → 42396 [SYN, ACK] Seq=0 Ack=1 Win=64000 Len=0 MSS=1288 WS=1 SACK_PERM
  150 4.998246831 target ip → host ip   TCP 52 135 → 38502 [SYN, ACK] Seq=0 Ack=1 Win=65535 Len=0 MSS=1288 WS=256 SACK_PERM
  232 6.277318520 target ip → host ip   TCP 52 3389 → 42398 [SYN, ACK] Seq=0 Ack=1 Win=64000 Len=0 MSS=1288 WS=1 SACK_PERM
  235 6.857444881 target ip → host ip   TCP 52 135 → 38504 [SYN, ACK] Seq=0 Ack=1 Win=65535 Len=0 MSS=1288 WS=256 SACK_PERM

# openポートの確認
$ cat sT_result.txt | grep -F "[SYN, ACK]" | awk '{print $8}' | sort -n -u
21
53
80
135
3389
SYN/ACK を返しているポートが open と判定されており、nmap のスキャン結果と tshark のログが一致していることが確認できた。
最後に、awk を使って TCP ハンドシェイク(SYN → SYN/ACK → ACK)が実際に成立しているかを確認してみる。
$ awk '
  # 行中の「<num> → <num>」を1組だけ抜き出す
  match($0, /[[:space:]]([0-9]+)[[:space:]]*→[[:space:]]*([0-9]+)[[:space:]]/, m) {
    if (m[1]==21 || m[2]==21) print
  }
' sT_result.txt
   52 2.896504834   host ip → target ip TCP 60 43260 → 21 [SYN] Seq=0 Win=64240 Len=0 MSS=1460 SACK_PERM TSval=245777632 TSecr=0 WS=128
   61 3.272603426 target ip → host ip   TCP 52 21 → 43260 [SYN, ACK] Seq=0 Ack=1 Win=65535 Len=0 MSS=1288 WS=256 SACK_PERM
   62 3.272698420   host ip → target ip TCP 40 43260 → 21 [ACK] Seq=1 Ack=1 Win=64256 Len=0
   65 3.273693028   host ip → target ip TCP 40 43260 → 21 [RST, ACK] Seq=1 Ack=1 Win=64256 Len=0
TCP ハンドシェイクが成立していることが分かる。
SYNスキャン(ハーフオープンスキャン)
使用頻度上位 100 ポートのみ(–top-ports 100)、スキャン中の詳細を表示(-vv)、pingをスキップ(-Pn)して
SYNスキャン(-sS)。
$ sudo nmap -sS --top-ports 100 -vv -Pn target ipopenポートを発見。
Host discovery disabled (-Pn). All addresses will be marked 'up' and scan times may be slower.
Starting Nmap 7.95 ( https://nmap.org ) at 2025-10-26 13:06 JST
Initiating Parallel DNS resolution of 1 host. at 13:06
Completed Parallel DNS resolution of 1 host. at 13:06, 0.00s elapsed
Initiating SYN Stealth Scan at 13:06
Scanning target ip [100 ports]
Discovered open port 80/tcp on target ip
Discovered open port 21/tcp on target ip
Discovered open port 3389/tcp on target ip
Discovered open port 135/tcp on target ip
Discovered open port 53/tcp on target ip
Completed SYN Stealth Scan at 13:06, 6.14s elapsed (100 total ports)
Nmap scan report for target ip
Host is up, received user-set (0.34s latency).
Scanned at 2025-10-26 13:06:36 JST for 7s
Not shown: 95 filtered tcp ports (no-response)
PORT     STATE SERVICE       REASON
21/tcp   open  ftp           syn-ack ttl 124
53/tcp   open  domain        syn-ack ttl 124
80/tcp   open  http          syn-ack ttl 124
135/tcp  open  msrpc         syn-ack ttl 124
3389/tcp open  ms-wbt-server syn-ack ttl 124

Read data files from: /usr/share/nmap
Nmap done: 1 IP address (1 host up) scanned in 6.20 seconds
           Raw packets sent: 197 (8.668KB) | Rcvd: 7 (308B)
今度は pcap でログを取ってみる。
$ sudo tshark -i tun0 -w /tmp/Ss_result.pcap
Running as user "root" and group "root". This could be dangerous.
Capturing on 'tun0'
211 ^C
# tshark で全体のログを確認
$ sudo tshark -r Ss_result.pcap
Running as user "root" and group "root". This could be dangerous.
1 0.000000000 host ip → target ip TCP 44 63626 → 993 [SYN] Seq=0 Win=1024 Len=0 MSS=1460
2 0.000010601 host ip → target ip TCP 44 63626 → 445 [SYN] Seq=0 Win=1024 Len=0 MSS=1460
3 0.000011875 host ip → target ip TCP 44 63626 → 110 [SYN] Seq=0 Win=1024 Len=0 MSS=1460
4 0.000012902 host ip → target ip TCP 44 63626 → 23 [SYN] Seq=0 Win=1024 Len=0 MSS=1460
5 0.000013856 host ip → target ip TCP 44 63626 → 111 [SYN] Seq=0 Win=1024 Len=0 MSS=1460
6 0.000014615 host ip → target ip TCP 44 63626 → 80 [SYN] Seq=0 Win=1024 Len=0 MSS=1460
7 0.000015329 host ip → target ip TCP 44 63626 → 3389 [SYN] Seq=0 Win=1024 Len=0 MSS=1460
8 0.000016047 host ip → target ip TCP 44 63626 → 113 [SYN] Seq=0 Win=1024 Len=0 MSS=1460
9 0.000016757 host ip → target ip TCP 44 63626 → 21 [SYN] Seq=0 Win=1024 Len=0 MSS=1460
10 0.000017461 host ip → target ip TCP 44 63626 → 587 [SYN] Seq=0 Win=1024 Len=0 MSS=1460
11 0.338039856 target ip → host ip TCP 44 80 → 63626 [SYN, ACK] Seq=0 Ack=1 Win=64400 Len=0 MSS=1288
12 0.338076236 host ip → target ip TCP 40 63626 → 80 [RST] Seq=1 Win=0 Len=0
13 0.338747181 target ip → host ip TCP 44 21 → 63626 [SYN, ACK] Seq=0 Ack=1 Win=64400 Len=0 MSS=1288
14 0.338809373 host ip → target ip TCP 40 63626 → 21 [RST] Seq=1 Win=0 Len=0
15 0.339557912 target ip → host ip TCP 44 3389 → 63626 [SYN, ACK] Seq=0 Ack=1 Win=64000 Len=0 MSS=1288
16 0.339571791 host ip → target ip TCP 40 63626 → 3389 [RST] Seq=1 Win=0 Len=0
(省略)ログを絞って確認。
# SYN 以外のログで絞ってみる
$ sudo tshark -r sS_result.pcap -Y "not (tcp.flags.syn==1 && tcp.flags.ack==0)"
Running as user "root" and group "root". This could be dangerous.
   11 0.338039856 target ip8 → host ip   TCP 44 80 → 63626 [SYN, ACK] Seq=0 Ack=1 Win=64400 Len=0 MSS=1288
   12 0.338076236   host ip → target ip8 TCP 40 63626 → 80 [RST] Seq=1 Win=0 Len=0
   13 0.338747181 target ip8 → host ip   TCP 44 21 → 63626 [SYN, ACK] Seq=0 Ack=1 Win=64400 Len=0 MSS=1288
   14 0.338809373   host ip → target ip8 TCP 40 63626 → 21 [RST] Seq=1 Win=0 Len=0
   15 0.339557912 target ip8 → host ip   TCP 44 3389 → 63626 [SYN, ACK] Seq=0 Ack=1 Win=64000 Len=0 MSS=1288
   16 0.339571791   host ip → target ip8 TCP 40 63626 → 3389 [RST] Seq=1 Win=0 Len=0
   23 0.677269837 target ip8 → host ip   TCP 44 135 → 63626 [SYN, ACK] Seq=0 Ack=1 Win=64400 Len=0 MSS=1288
   24 0.677332313   host ip → target ip8 TCP 40 63626 → 135 [RST] Seq=1 Win=0 Len=0
   55 3.165016037 target ip8 → host ip   TCP 44 53 → 63626 [SYN, ACK] Seq=0 Ack=1 Win=64400 Len=0 MSS=1288
   56 3.165076706   host ip → target ip8 TCP 40 63626 → 53 [RST] Seq=1 Win=0 Len=0
   57 3.165703655 target ip8 → host ip   TCP 44 80 → 63631 [SYN, ACK] Seq=0 Ack=1 Win=64400 Len=0 MSS=1288
   58 3.165753573   host ip → target ip8 TCP 40 63631 → 80 [RST] Seq=1 Win=0 Len=0
  173 4.863356730 target ip8 → host ip   TCP 44 80 → 63633 [SYN, ACK] Seq=0 Ack=1 Win=64400 Len=0 MSS=1288
  174 4.863426175   host ip → target ip8 TCP 40 63633 → 80 [RST] Seq=1 Win=0 Len=0

# SYN/ACK(open)で絞ってみる
$ sudo tshark -r sS_result.pcap -Y "tcp.flags.syn==1 && tcp.flags.ack==1"
Running as user "root" and group "root". This could be dangerous.
   11 0.338039856 target ip8 → host ip   TCP 44 80 → 63626 [SYN, ACK] Seq=0 Ack=1 Win=64400 Len=0 MSS=1288
   13 0.338747181 target ip8 → host ip   TCP 44 21 → 63626 [SYN, ACK] Seq=0 Ack=1 Win=64400 Len=0 MSS=1288
   15 0.339557912 target ip8 → host ip   TCP 44 3389 → 63626 [SYN, ACK] Seq=0 Ack=1 Win=64000 Len=0 MSS=1288
   23 0.677269837 target ip8 → host ip   TCP 44 135 → 63626 [SYN, ACK] Seq=0 Ack=1 Win=64400 Len=0 MSS=1288
   55 3.165016037 target ip8 → host ip   TCP 44 53 → 63626 [SYN, ACK] Seq=0 Ack=1 Win=64400 Len=0 MSS=1288
   57 3.165703655 target ip8 → host ip   TCP 44 80 → 63631 [SYN, ACK] Seq=0 Ack=1 Win=64400 Len=0 MSS=1288
  173 4.863356730 target ip8 → host ip   TCP 44 80 → 63633 [SYN, ACK] Seq=0 Ack=1 Win=64400 Len=0 MSS=1288

# openポートの確認
$ sudo tshark -r sS_result.pcap -Y "tcp.flags.syn==1 && tcp.flags.ack==1" -T fields -e tcp.srcport | sort -n -u
Running as user "root" and group "root". This could be dangerous.
21
53
80
135
3389
SYN/ACK を返しているポートが open になっているので、nmap の結果と tshark のログは一致している。
ハーフオープンスキャン(SYN→SYN/ACK→RST)を本当にしているか確認してみる。
$ sudo tshark -r sS_result.pcap -Y "tcp.port == 21"
Running as user "root" and group "root". This could be dangerous.
    9 0.000016757   host ip → target ip TCP 44 63626 → 21 [SYN] Seq=0 Win=1024 Len=0 MSS=1460
   13 0.338747181 target ip → host ip   TCP 44 21 → 63626 [SYN, ACK] Seq=0 Ack=1 Win=64400 Len=0 MSS=1288
   14 0.338809373   host ip → target ip TCP 40 63626 → 21 [RST] Seq=1 Win=0 Len=0
SYN/ACK に対して RST で切断しているため、ハーフオープンスキャンの挙動。
UDPスキャン
使用頻度上位 100 ポートのみ(–top-ports 100)、スキャン中の詳細を表示(-vv)、pingをスキップ(-Pn)して
UDPスキャン(-sU)。
$ sudo nmap -sU --top-ports 100 -vv -Pn target ipopenポートを発見。
Host discovery disabled (-Pn). All addresses will be marked 'up' and scan times may be slower.
Starting Nmap 7.95 ( https://nmap.org ) at 2025-10-26 14:03 JST
Initiating Parallel DNS resolution of 1 host. at 14:03
Completed Parallel DNS resolution of 1 host. at 14:03, 0.00s elapsed
Initiating UDP Scan at 14:03
Scanning target ip [100 ports]
Discovered open port 53/udp on target ip
Completed UDP Scan at 14:03, 12.09s elapsed (100 total ports)
Nmap scan report for target ip
Host is up, received user-set (0.36s latency).
Scanned at 2025-10-26 14:03:17 JST for 11s
Not shown: 99 open|filtered udp ports (no-response)
PORT   STATE SERVICE REASON
53/udp open  domain  udp-response ttl 124

Read data files from: /usr/share/nmap
Nmap done: 1 IP address (1 host up) scanned in 12.15 seconds
           Raw packets sent: 261 (16.044KB) | Rcvd: 4 (262B)
pcap でログを取ってみる。
$ sudo tshark -i tun0 -w /tmp/sU_result.pcap
Running as user "root" and group "root". This could be dangerous.
Capturing on 'tun0'
273 ^C
今回は Wireshar でログを確認してみる。
$ sudo wireshark sU_result.pcap ip.src == target ip で応答のあったものだけ絞る。
ip.src == target ip && not icmp
DNS のみ表示されたので、nmap の結果と一致。
特殊スキャン(NULL/FIN/Xmas)
検証環境でopenポートが見つからなかったので、今回はフラグだけ確認。
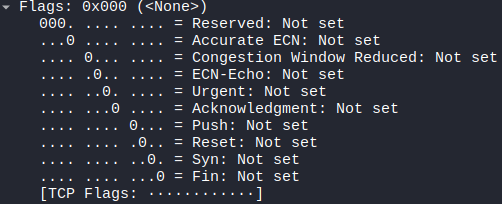
NULLスキャン
# NULLスキャン
$ sudo nmap -sN --top-ports 100 -vv -Pn target ip

Host discovery disabled (-Pn). All addresses will be marked 'up' and scan times may be slower.
Starting Nmap 7.95 ( https://nmap.org ) at 2025-10-26 14:57 JST
Initiating Parallel DNS resolution of 1 host. at 14:57
Completed Parallel DNS resolution of 1 host. at 14:57, 0.00s elapsed
Initiating NULL Scan at 14:57
Scanning target ip [100 ports]
Completed NULL Scan at 14:57, 21.11s elapsed (100 total ports)
Nmap scan report for target ip
Host is up, received user-set.
Scanned at 2025-10-26 14:57:12 JST for 22s
All 100 scanned ports on target ip are in ignored states.
Not shown: 100 open|filtered tcp ports (no-response)

Read data files from: /usr/share/nmap
Nmap done: 1 IP address (1 host up) scanned in 21.15 seconds
           Raw packets sent: 200 (8.000KB) | Rcvd: 0 (0B)
フラグはすべて0。
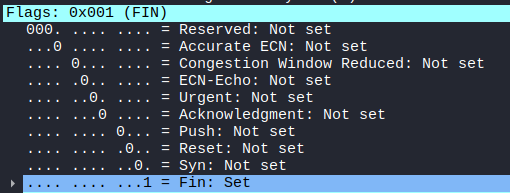
FINスキャン
# FINスキャン
$ sudo nmap -sF --top-ports 100 -vv -Pn target ip

Host discovery disabled (-Pn). All addresses will be marked 'up' and scan times may be slower.
Starting Nmap 7.95 ( https://nmap.org ) at 2025-10-26 14:52 JST
Initiating Parallel DNS resolution of 1 host. at 14:52
Completed Parallel DNS resolution of 1 host. at 14:52, 0.00s elapsed
Initiating FIN Scan at 14:52
Scanning target ip [100 ports]
Completed FIN Scan at 14:52, 21.09s elapsed (100 total ports)
Nmap scan report for target ip
Host is up, received user-set.
Scanned at 2025-10-26 14:52:08 JST for 21s
All 100 scanned ports on target ip are in ignored states.
Not shown: 100 open|filtered tcp ports (no-response)

Read data files from: /usr/share/nmap
Nmap done: 1 IP address (1 host up) scanned in 21.18 seconds
           Raw packets sent: 200 (8.000KB) | Rcvd: 0 (0B)
FIN = 1。
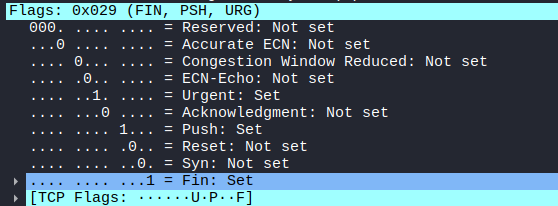
Xmasスキャン
# Xmasスキャン
$ sudo nmap -sX --top-ports 100 -vv -Pn target ip

Host discovery disabled (-Pn). All addresses will be marked 'up' and scan times may be slower.
Starting Nmap 7.95 ( https://nmap.org ) at 2025-10-26 14:52 JST
Initiating Parallel DNS resolution of 1 host. at 14:52
Completed Parallel DNS resolution of 1 host. at 14:52, 0.01s elapsed
Initiating XMAS Scan at 14:52
Scanning target ip [100 ports]
Completed XMAS Scan at 14:53, 21.09s elapsed (100 total ports)
Nmap scan report for target ip
Host is up, received user-set.
Scanned at 2025-10-26 14:52:53 JST for 21s
All 100 scanned ports on target ip are in ignored states.
Not shown: 100 open|filtered tcp ports (no-response)

Read data files from: /usr/share/nmap
Nmap done: 1 IP address (1 host up) scanned in 21.16 seconds
           Raw packets sent: 200 (8.000KB) | Rcvd: 0 (0B)
FIN = 1、PSH = 1、URG = 1。
おまけ
UDPスキャンでホストIPとターゲットIP以外に 239.255.255.250(SSDP1用マルチキャストアドレス)への通信を発見。

nmapはスキャン中に「このネットワーク内にUPnP2デバイスがいるか?」を自動的にチェックすることがあり、その時にこの宛先へ M-SEARCH * HTTP/1.1 パケットを送信するそう。


コメント